Data Analyst
From your first spreadsheet formula to leading analytics: SQL, statistics, dashboards and decisions.
- Lessons
- 99 lessons
- Time
- Job-ready in about 8 months at 10 h a week
- Creators
- 55 creators on YouTube
- Learners saving progress
- 1 learners
Curated by SageLords
Explorer to Expert
13 stages. Job-ready in about 8 months. The track keeps going for 2 levels past the hire line, learned alongside your job, so they aren't counted.
Levels describe what you can do in this career. They aren't job titles and don't match any company's levels.
Who it's for
For people who like answering questions with evidence, are comfortable being precise, and are willing to spend most of their time on clarifying questions and messy data rather than on charts. No degree or programming background is required, and it is one of the most accessible entry points into data careers. The later phases are for working analysts aiming at senior, staff and leadership roles. Not for you if you mainly want to build machine-learning models in production (see ML / AI Engineer), want to build data pipelines and infrastructure (see Data Engineer), or dislike explaining your work to non-technical people, because that is half the job.
Where this takes you
You can turn a vague request into a clear question, get and clean the data yourself in SQL, spreadsheets and pandas, analyse it with appropriate statistics, build dashboards people use, and write and present recommendations that change decisions. To reach the hire line you hold a public GitHub repository with a core-skills portfolio, an independent analysis built from a spec, a dbt project, and a self-scoped portfolio analysis with a memo, plus a rehearsed interview loop. Beyond it, you hold evidence of production ownership (an experiment you read out, a data asset you own with tests and incident history, decision documents that informed real decisions) and of organisational impact (decisions you influenced, analysts you grew, and a metrics or operating-model change you led).
Syllabus
Every lesson is open. The order is a recommendation, not a lock.
Explorer, three levels below the hire line
1 stage · about 3 hours
1
Orientation
You can decide, with evidence, whether data analysis is a career you want to spend the next year working towards.
Learn5 lessons · about 3 hours- 1
 What data analysts actually do all dayAgathaStart here
- 2
 Telling data analyst, data scientist and data engineer apartData with Baraa
- 3
 The entry-level market, honestly: pay, competition and what gets people hiredAvery Smith | Data Analyst
- 4
 How a business question becomes an analysis and then a decisionDavid Langer
- 5Milestone: write your decision
- 1
Novice, two levels below the hire line
1 stage · about 5 weeks
2
Foundations: spreadsheets, data literacy and first SQL
You can clean and summarise a small dataset in a spreadsheet and answer simple questions about a relational database with SQL, following guidance.
Learn10 lessons · about 5 weeksGuided build- 6
 Spreadsheet formulas, references and core functionsAlex The Analyst
- 7
 Lookups, conditional aggregation and pivot tablesKevin Stratvert
- 8
 Cleaning messy data in a spreadsheet with Power QueryKenji Explains
- 9
 Reading data critically: tidy data, grain and data typesyuzaR Data Science
- 10
 Describing data honestly: averages, spread and distributionsGrad Coach
- 11
 How relational databases organise data: tables, keys and relationshipsIBM Technology
- 12
 SQL basics: selecting, filtering and sortingLuke Barousse
- 13
 SQL joins: combining tables without multiplying rowsData with Baraa
- 14
 SQL aggregation: GROUP BY, HAVING and counting correctlyBecoming a Data Scientist
- 15
 Guided build: an interactive spreadsheet dashboardMaven Analytics
Prove it: Guided build
Produce two things. (1) A spreadsheet workbook from the guided dashboard project, rebuilt on your own copy of the data, with a separate 'Notes' tab listing every cleaning step you applied and how many rows each affected. (2) A text file of at least 25 SQL queries you wrote and ran against a sample database (SQLBolt, pgexercises or the course database), each preceded by a one-line comment stating the business question it answers. It is good when: the workbook's pivot totals reconcile to the raw data total; no formula contains a hard-coded number that should be a cell reference; every query runs without error; at least eight queries use a JOIN and at least eight use GROUP BY; and the comments describe questions, not syntax ('which customers ordered more than twice', not 'GROUP BY with HAVING'). Following the tutorial closely is fine here; copying its files without running them is not.
- 6
Advanced beginner, one level below the hire line
2 stages · about 3 months
3
Core skills: SQL depth, statistics, Python and dashboards
You can answer multi-step business questions with CTEs and window functions, test whether a difference is real, explore data in pandas and present it in a dashboard, with tutorials as reference rather than script.
Learn10 lessons · about 8 weeksGuided build- 16
 Breaking queries into steps with subqueries and CTEsMaven Analytics
- 17
 Window functions: rankings, running totals and period-over-periodData with Baraa
- 18
 Conditional logic, dates and NULLs in SQLData with Baraa
- 19
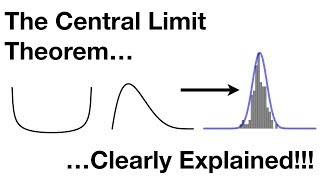 Sampling, the central limit theorem and confidence intervalsStatQuest with Josh Starmer
- 20
 Hypothesis testing, p-values and practical significanceStatQuest with Josh Starmer
- 21
 Correlation and simple regression for analystsStatQuest with Josh Starmer
- 22
 Python fundamentals for data workAlex The Analyst
- 23
 Analysing data with pandas: selecting, grouping, joining and cleaningAlex The Analyst
- 24
 Choosing the right chart and designing it to make one pointMaven Analytics
- 25
 Building a dashboard in a BI tool (Power BI, Tableau or Looker Studio)Alex The Analyst
Prove it: Guided build
Produce a public GitHub repository named 'analyst-core-skills' containing: (1) a sql/ folder with at least 20 solved problems from the 8 Week SQL Challenge or DataLemur, each file headed by the question in plain English, at least eight using window functions and at least six using CTEs; (2) a notebook that loads a public dataset with pandas, performs one grouped analysis and one join, and runs one hypothesis test with the result written as a sentence a manager would understand; and (3) a screenshot and link of a one-page dashboard you built in Power BI, Tableau Public or Looker Studio following a course. It is good when: every SQL file runs; window-function solutions use PARTITION BY correctly rather than self-joins; the notebook runs top to bottom on a fresh kernel; the hypothesis-test sentence states the effect size and the uncertainty, not just 'p < 0.05'; and the dashboard has no more than six visuals, each with a title that states what it shows. Following guided material is expected here; the evidence is that you ran and adapted it, not that you invented it.
- 16
4
First independent analysis
You can deliver a complete analysis from a written specification, using SQL and a dashboard, with no video guiding you.
Build4 lessons · about 4 weeksIndependent project- 26Turning a spec into an analysis planLocally Optimistic
- 27Project: e-commerce analysis from a spec (Olist)Olist on Kaggle
- 28
 Writing up an analysis so someone reads itChristine Jiang
- 29Milestone: ship it and get one outside review
Prove it: Independent project
A public GitHub repository and a published dashboard that answer the six questions in the Olist spec below. Submit: the repo link (SQL files, a README, and a data-cleaning log) and the dashboard link. It is good when: every query runs against the loaded data and is commented with the question it answers; the cleaning log lists each issue found, the rows affected and the decision taken; row counts are checked after every join, and the README says so; the dashboard fits on one screen and each visual answers one of the spec questions with a title that states the finding; the README opens with three bullet-point findings a manager could act on, followed by method and a 'What I could not conclude' section. A submission with no stated limitations, or any number in the README that cannot be traced to a query, is not finished.
Job-ready after this level
Competent, the hire line
2 stages · about 3 months
5
Professional practice: how analytics teams actually work
You can take a vague request, model and clean the data reproducibly, build tested dbt models under version control, and document the result so a colleague could maintain it.
Practice9 lessons · about 5 weeksGuided build- 30
 Gathering requirements from stakeholdersChristine Jiang
- 31
 Cleaning data at scale, reproduciblyAlex The Analyst
- 32
 Writing SQL that does not time out: execution order, plans and indexesByteByteGo
- 33
 Dimensional modelling: facts, dimensions and grainKahan Data Solutions
- 34
 The modern data stack and dbt fundamentalsBugBytes
- 35
 Version control for analysts: Git, branches and pull requestsAlex The Analyst
- 36
 Documentation, data dictionaries and reproducible analysisAtlan
- 37
 Funnel, cohort and retention analysismackan.sql: Senior Data Analytics & Modeling
- 38
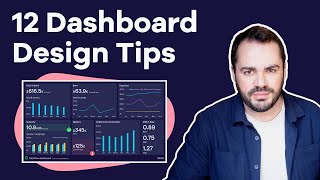 Designing dashboards people actually useGeckoboard
Prove it: Guided build
Produce a public GitHub repository containing a small dbt project built on the jaffle-shop sample data (or the Olist data from your first analysis) running on DuckDB. It must have: staging models for each source; at least one fact and one dimension model with the grain stated in the model description; generic tests (unique, not_null, relationships, accepted_values) on every primary and foreign key; one cohort-retention model; a sources.yml with descriptions; and a README with a one-paragraph requirements summary written as if for a stakeholder. It is good when: `dbt build` passes from a fresh clone following only the README; every model has a description; the commit history shows at least ten commits on feature branches merged via pull request; one pull request contains a review comment you wrote to yourself explaining a design choice; and the cohort model's numbers reconcile with a hand-written SQL check you include in the repo.
- 30
6
Portfolio piece
You can scope, execute and defend an end-to-end analysis on a question you chose yourself, and present it so a hiring manager understands its value in two minutes.
Build5 lessons · about 7 weeksPortfolio piece- 39
 Choosing a question worth answeringChristine Jiang
- 40Finding and acquiring real dataU.S. General Services Administration
- 41
 Project: your own end-to-end analysisLore So What
- 42
 Publishing and presenting the workChristine Jiang
- 43Milestone: a portfolio review by a working analyst
Prove it: Portfolio piece
One self-scoped, end-to-end analysis published as a GitHub repository plus a dashboard or report, with a one-page memo addressed to a named (real or realistic) decision-maker. It must include: a problem statement saying who would use the result and what decision it informs; data you sourced yourself (public data, an API or your own collection, not a pre-cleaned Kaggle competition set); SQL or dbt for transformation; at least one statistical check of whether a key difference is real; and a recommendation. It is good when: a non-analyst can state the recommendation after reading only the memo; every number in the memo traces to code in the repo; the README documents at least three judgement calls and the alternatives you rejected; there is a limitations section; and you can explain, in a recorded five-minute walkthrough or out loud to a reviewer, why you built it this way and what you would do with another month.
- 39
Landing the job
2 stages · about 7 weeks
7
Interview prep: the analyst loop
You can pass a timed SQL screen, structure an analytics case study out loud, deliver a clean take-home, and tell three project stories with measurable outcomes.
Career6 lessons · about 5 weeks8
Get hired
You can run a focused job search that turns your portfolio into interviews and an offer, and start the new role well.
Career6 lessons · about 2 weeks- 50
 A CV and LinkedIn profile that survive the six-second scanJess Ramos | Data, AI, & Tech ⚡️
- 51
 Targeting the right roles, levels and adjacent titlesAlex The Analyst
- 52
 Referrals, communities and warm applicationsJeff Su
- 53
 Evaluating and negotiating an offerJeff Su
- 54
 Your first 90 days as an analystJeff Su
- 55Milestone: hired
- 50



Proficient, one level above the hire line
3 stages · learned alongside your job
9
Experimentation, causal thinking and metric design
You can design, size and read out an A/B test, reason about causation when you cannot randomise, and design metrics and metric trees that a team can act on without gaming them.
Learn9 lessons · about 4 weeksProduction ownership- 56
 Designing a trustworthy A/B testfreeCodeCamp.org
- 57
 Sample size, power and minimum detectable effectDataInterview
- 58
 Reading an experiment without fooling yourselfEmma Ding
- 59
 Confounding, selection bias and Simpson's paradoxminutephysics
- 60
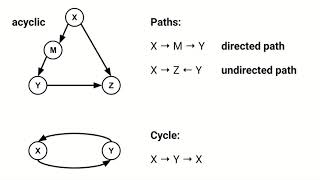 Thinking in causal diagrams (DAGs)Leslie Myint
- 61
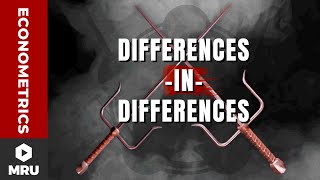 Quasi-experiments: difference-in-differences and regression discontinuityMarginal Revolution University
- 62
 Designing metrics: success, driver and guardrail metricsEmma Ding
- 63
 Building metric trees that connect daily work to outcomesAI Council
- 64Project: own an experiment from design to decisionGrowthBook
Prove it: Production ownership
Own the analysis for at least one real experiment (or, where your company cannot randomise, one quasi-experimental causal analysis) from design to decision, and produce: a pre-registration document written before launch (hypothesis, primary metric, guardrail metrics, randomisation unit, minimum detectable effect, sample size and run length, decision rule); the readout (effect size with a confidence interval, sample-ratio-mismatch check, guardrail results, segment caveats); and a one-paragraph note on the decision taken. Add a metric tree for your team's primary outcome metric. It is good when: the pre-registration is dated before the start of the test; the readout reports uncertainty, not just significance; the SRM check is shown; you resisted or explicitly flagged any peeking or post-hoc segment fishing; the decision maker confirms in writing that the readout informed the decision; and the metric tree's leaf metrics are things a team can directly influence. If you are not yet in a role that runs experiments, do the same on the public Kaggle A/B testing dataset, but treat that as practice and not as this phase's evidence.
- 56
10
Analytics engineering, data quality and governance
You can own a production dashboard or data model that other people depend on: tested, monitored, documented, governed and recovered quickly when it breaks.
Practice10 lessons · about 3 weeksProduction ownership- 65
 What analytics engineering is and why analysts need itMaggie In Data
- 66
 Testing data: dbt tests, unit tests and source freshnessThe Data and AI Guy
- 67
 Incremental models, snapshots and warehouse costKahan Data Solutions
- 68
 One definition of every metric: semantic layers and metric governanceDawn Choo
- 69
 Data quality dimensions and observabilityIBM Technology
- 70
 Data contracts with upstream teamsStarburst
- 71
 Data governance, access and privacyIBM Technology
- 72
 Owning a production dashboard: consumers, SLAs, lineage and deprecationSeattle Data Guy
- 73
 Handling data incidents and writing blameless postmortemsBran van der Meer
- 74Project: take ownership of a production assetGitLab
Prove it: Production ownership
Own one production data asset (a dashboard, a dbt model set, or a recurring report) used by at least one other team for at least three months, and produce an ownership pack: a README naming the owner, consumers, refresh schedule, metric definitions and known caveats; automated tests and freshness checks on its inputs with a log of failures caught; a lineage diagram from sources to the asset (dbt docs or exposures are fine); an access and privacy review stating what personal data it touches and who can see it; and at least one incident write-up in blameless postmortem format. It is good when: a consumer can find the definition of every metric on the asset without asking you; tests have caught at least one real problem before a stakeholder did; the incident write-up names the root cause, the time to detect and the preventive action, without blaming a person; personal data is minimised and access is justified; and a colleague could take over the asset from the ownership pack alone.
- 65
11
Analysis memos, decision docs and executive communication
You can write an analysis memo or decision document that a senior leader reads, understands and acts on, and present it to executives under time pressure and pushback.
Practice8 lessons · about 3 weeksProduction ownership- 75
 Writing that creates value for the readerUChicago Social Sciences
- 76
 Answer first: the pyramid principle and BLUFAlexander Lyon Communication Coach
- 77Writing the analysis memoHarvard Kennedy School Communications Program
- 78Decision documents and narrative memosReleased
- 79
 Communicating uncertainty honestly to decision makersGovernment Analysis Function
- 80
 Presenting to executivesDr. Grace Lee
- 81
 Data storytelling for senior audiencesTalks at Google
- 82Project: write and deliver a decision documentReleased
Prove it: Production ownership
Write and deliver three decision-facing documents at work over at least two months: at least one analysis memo (one to two pages) and at least one longer decision document or narrative (three to six pages) with options and a recommendation, plus one executive presentation of either. Keep each document, the feedback you received and the decision taken. It is good when: each document states the recommendation or answer in its first three sentences; a reader can understand the key point from the headings alone; every claim with a number shows its uncertainty or caveats; options are presented fairly, including the one you do not recommend; the decision maker can name what they decided and confirms the document informed it; and your second and third documents show measurable improvement in reader feedback (for example, fewer clarifying questions or a shorter meeting). If you share them outside your company, redact anything confidential.
- 75
Expert, two levels above the hire line
2 stages · learned alongside your job
12
Analytics leadership: influence, mentoring and team craft
You can change decisions you do not own, raise the quality of other analysts' work through review and mentoring, and choose deliberately between the staff and management paths.
Practice9 lessons · about 2 weeksOrg impact- 83
 Influencing decisions you do not ownKeith Ferrazzi
- 84Prioritising analytics work and saying noLocally Optimistic
- 85
 Reviewing other analysts' workMatt Stauffer
- 86
 Giving honest, useful feedbackRadical Candor®
- 87Mentoring, coaching and sponsoring analystsLara Hogan, via Pluralsight
- 88
 Choosing between the staff IC and management pathsGoogle for Developers
- 89
 Managing analysts for the first timeFranklinCovey
- 90
 Hiring analystsOptionalLenny's Podcast
- 91Milestone: a decision changed, a colleague grown
Prove it: Org impact
Over at least six months, produce a leadership portfolio: (1) a written account of one decision you changed without having authority over it, with the before and after and the evidence of your role; (2) an analysis review checklist you introduced for your team and a log of at least ten reviews you gave using it; (3) a mentoring record for at least one less experienced analyst, with their goals, what you worked on and their own written assessment of the outcome; and (4) a one-page career decision note on whether you are pursuing the staff or management path and why. It is good when: the changed decision is confirmed by the decision maker; review comments focus on correctness and clarity rather than style, and the checklist caught at least one real error; the mentee can name a skill they gained and a piece of work it improved; and the career note is grounded in what you enjoy doing day to day, not in title or pay alone.
- 83
13
Metrics strategy and organisational impact
You can set the metrics an organisation runs on, design how its analytics function is organised, and show the business value that function creates.
Practice8 lessons · about 4 weeksOrg impact- 92
 North star metrics and metric hierarchiesAced (formerly Exponent)
- 93
 Metrics strategy, goal setting and OKRsWhat Matters
- 94
 Analytics team operating models: centralised, embedded and hybridValue Driven Analytics
- 95Building an analytics functionLenny's Podcast
- 96
 Building data culture and enablementLenny's Podcast
- 97
 Writing a data and analytics strategyIBM Technology
- 98
 Measuring and communicating the impact of analyticsCount
- 99Project: lead an organisation-level metrics or operating-model changeAmplitude
Prove it: Org impact
Lead one organisation-level change and document it: either (a) defining or redesigning a company's or division's metric framework (north star, metric tree, owners, definitions and review cadence) and getting it adopted in planning, or (b) designing and implementing a change to how the analytics function is organised or operates (team structure, intake and prioritisation, self-serve strategy). Produce the proposal document, the adoption evidence and a value assessment six months later. It is good when: the proposal was approved by the leader who owns the outcome; the metric framework or operating model is visibly in use (planning documents, recurring reviews, OKRs reference it); each metric or team has a named owner; the value assessment cites specific decisions the change affected and estimates their impact honestly, including uncertainty; and you can describe what you would do differently and what did not work.
- 92
About this track
A data analyst is paid to help people make better decisions with data. The tools change (spreadsheets, SQL, Python, Power BI, dbt) but the job does not: find out what someone really needs to know, get data you can trust, analyse it without fooling yourself, and explain the answer so clearly that it changes what they do.
This roadmap covers the whole career, not just the first job. The first eight phases (about 365 hours, or roughly 37 weeks at ten hours a week) take you from no experience to the hire line: spreadsheets and data literacy, SQL in real depth (joins, CTEs, window functions, performance), statistics for analysts, pandas, dashboards, professional practice with dbt and Git, and the specific interview loop analysts face. You finish holding an independent analysis built from a written spec and a self-scoped portfolio piece that ends in a recommendation. The last five phases are what most free material never covers: experimentation and causal thinking, metric design and metric trees, analytics engineering and data quality, writing analysis memos and decision documents, presenting to executives, influencing decisions you do not own, mentoring, and building and measuring an analytics function. These assume you are working as an analyst; they are studied alongside the job over several years, and their evidence is real work in production and real decisions changed, not course projects. Be honest with yourself about the market. Entry-level analyst roles are crowded, and certificates alone no longer stand out. What gets people hired is real work on real data, clear writing, and a story about a decision their analysis informed. Many analysts enter sideways from operations, finance or marketing roles; if you can start analysing data in your current job, do.